By Mark Muro and Jacob Whiton, Brookings —
We’ve been harping for a while on the stark economic divides that define American life in the Donald Trump years.
To be sure, racial and cultural resentment have been the prime factors of the Trump backlash, but it’s also clear that the two parties speak for and to dramatically different segments of the American economy. Where Republican areas of the country rely on lower-skill, lower-productivity “traditional” industries like manufacturing and resource extraction, Democratic, mostly urban districts contain large concentrations of the nation’s higher-skill, higher-tech professional and digital services.
Yet now comes another wrinkle to the story. Not only are red and blue America experiencing two different economies, but those economies are diverging fast. In fact, radical change is transforming the two parties’ economies in real time. Which is a key takeaway of a new data analysis—published today—that we developed with the Wall Street Journal’s Aaron Zitner and Dante Chinni.
What do the new numbers show exactly? Based on standard economic data linked to recent congressional district outcomes that we have tracked over time, the Journal/Brookings analysis depicts above all the extreme pace in which the economies of the two parties’ districts are changing in this decade.
Some of the change is already familiar based on how the map of congressional vote outcomes has evolved in the last decade:
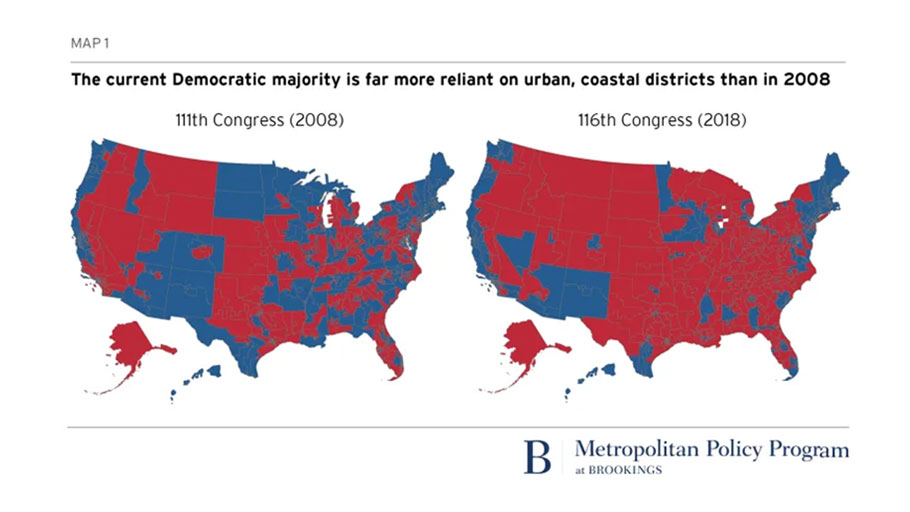 In the 111th Congress in 2008, Democratic-voting, often-urban districts encompassed 39% of U.S. land area compared with the 61% expanse of Republican districts. By the 116th Congress, just ten years later, the Democratic share had fallen to 20% of the map, with Republicans’ expanse rising to 80% of the nation’s land area. Certainly, those numbers point to economic change, although they also reflect gerrymandering and the low population density of rural areas.
In 2008, Democratic-voting, often-urban districts encompassed 39% of U.S. land area compared with the 61% expanse of Republican districts. By the 116th Congress, just ten years later, the Democratic share had fallen to 20% of the map.
Turn to our economic and demographic data, however, and it’s clear that a series of genuine, penetrating shifts have been happening at warp speed through the last decade. These shifts are massively altering the two parties’ economic identities.
For one thing, the two parties have in just 10 years gone from near-parity on prosperity and income measures to stark, fast-moving divergence.
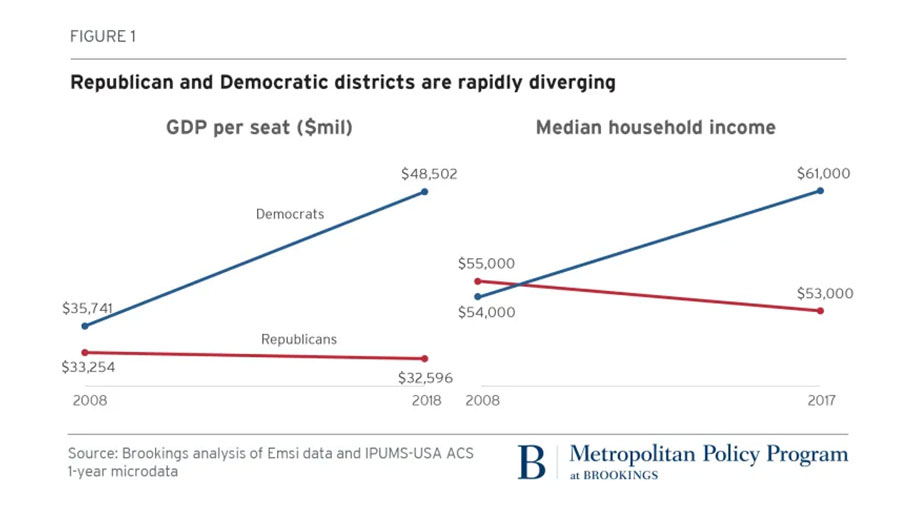 With their output surging as a result of the big-city tilt of the decade’s “winner-take-most” economy, Democratic districts have seen their median household income soar in a decade—from $54,000 in 2008 to $61,000 in 2018. By contrast, the income level in Republican districts began slightly higher in 2008, but then declined from $55,000 to $53,000.
Underlying these changes have been eye-popping shifts in economic performance. Democratic-voting districts have seen their GDP per seat grow by a third since 2008, from $35.7 billion to $48.5 billion a seat, whereas Republican districts saw their output slightly decline from $33.2 billion to $32.6 billion.
Looking deeper, it’s clear that big shifts in industry geography and composition are driving the parties’ changes of identity. Look at the matrix of 10-year trends depicted here:
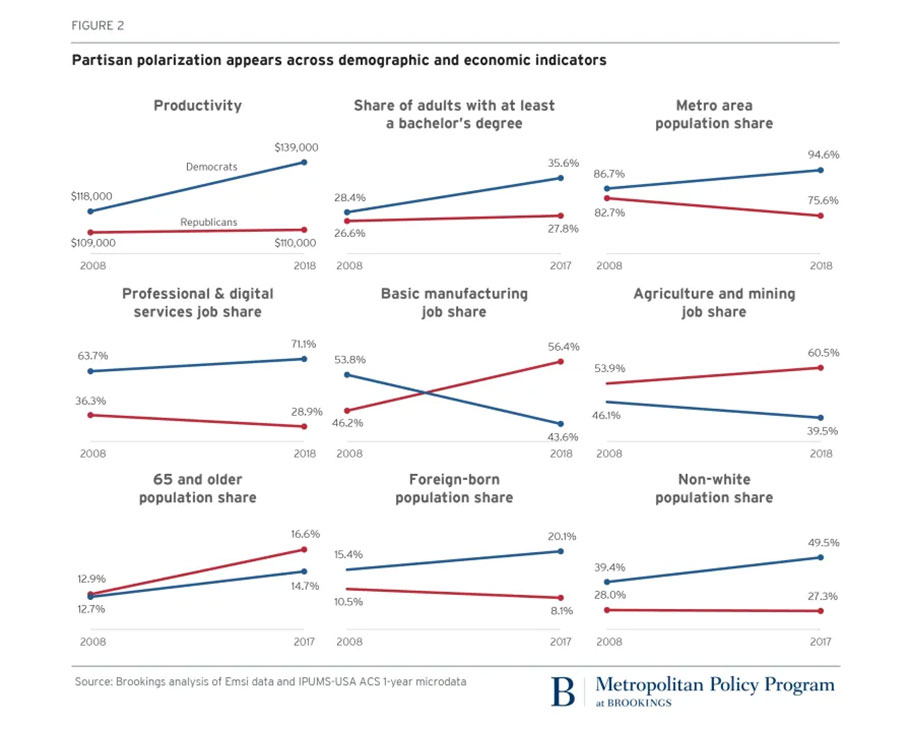 Democratic districts, for example, have grown significantly more dynamic in the last decade. Overall, “blue” territories have seen their productivity climb from $118,000 per worker in 2008 to $139,000 in 2018 as recent demographic changes and electoral sorting ensured they became better educated and more urban. Republican-district productivity, by contrast, remains stuck at about $110,000, reflecting only slight improvements of bachelor’s degree attainment and Republicans’ increasingly non-metro domain.
Relatedly, and equally striking, Democratic districts are rapidly increasing their dominance of the nation’s urban-tilting professional and digital services employment while ceding their historical, more rural shares of manufacturing and agriculture-mining activity. Just since 2008, Democratic districts’ share of professional and digital services employment surged from 63.7% to 71.1%, while their share of the nation’s manufacturing and extractive activities shrunk from 53.8% to 43.6% and 46.1% to 39.5%, respectively. Conversely, Republican districts—failing as a group to gain traction in the new sectors—have reverted to more “traditional” ones. GOP districts’ professional and digital employment fell from 36.3% to 28.9% of the total in just 10 years, for example, while their shares of manufacturing and agriculture-mining increased from 46.2% to 56.4% and 53.9% to 60.5%, respectively.
Democratic districts have seen their median household income soar in a decade—from $54,000 in 2008 to $61,000 in 2018. By contrast, the income level in Republican districts began slightly higher in 2008, but then declined from $55,000 to $53,000.
Related to these shifts have been dramatic demographic changes. In just a decade, Democratic-voting districts have become strikingly better educated and more diverse. For example, Democratic-voting districts have seen their share of adults with at least a bachelor’s degree rise from 28.4% in 2008 to 35.5%. For their part, Republican districts have barely increased their bachelor’s degree attainment beyond 26.6% and have meanwhile become notably whiter and older. Today, therefore, neither party represents the same types of places it did just 10 years ago. As such, the Democratic Party is now anchored in the nation’s booming, but highly unequal, metro areas, while the GOP relies on aging and economically stagnant manufacturing-reliant rural and exurban communities.
What might these divides look like in the future? It’s hard to imagine the current extreme shifts going much farther. The concentration of more than 70% of the nation’s professional and digital services economy in the territory of one party would seem to register an almost unsustainable degree of polarization.
At the same time, there are few signs of any coming reversal of the decade’s divergence. Instead, the current economic trends underlie the current party divide and reinforce it. For at least the foreseeable future, therefore, the nation seems destined to struggle with extreme economic, territorial, and political divides in which the two parties talk almost entirely past each other on the most important economic and social issues, like innovation, immigration, and education because they represent starkly separate and diverging worlds. Not only do the two parties adhere to very different views, but they inhabit increasingly different economies and environments.
“Blue” territories have seen their productivity climb from $118,000 per worker in 2008 to $139,000 in 2018. Republican-district productivity, by contrast, remains stuck at about $110,000.
And yet, perhaps there are possible meeting points. Maybe the urban, diverse, tech-oriented professional party and the exurban-rural party of older white males will find common cause on the “future of work” at a time of spreading dislocation from automation and the spread of precarious work in offices as well as factories and warehouses. Perhaps Democrats worried about climate change and Republicans weary of storm damage in the Midwest and along the Gulf Coast will be able to work together on responses to extreme weather. And for that matter maybe the two camps will soon themselves become worried enough about today’s massive regional and economic disparities to engage.
Or maybe not. It could be, instead, that the nation is only heading deeper into a period of continued stand-off, where economic change reinforces cultural backlash, and both gerrymandered districts and the Constitution’s allocation of two senators for every state prop up the political power of a declining fraction of the economy. If that’s how the politics of the decade’s changing economy are going to play out, then political analyst Ron Brownstein may be right that the nation may be heading deeper into an era of sustained turbulence that “pits what America has been against what it is becoming.”
Mark Muro: Senior Fellow and Policy Director – Metropolitan Policy Program
Jacob Whiton: Research Analyst – Metropolitan Policy Program

